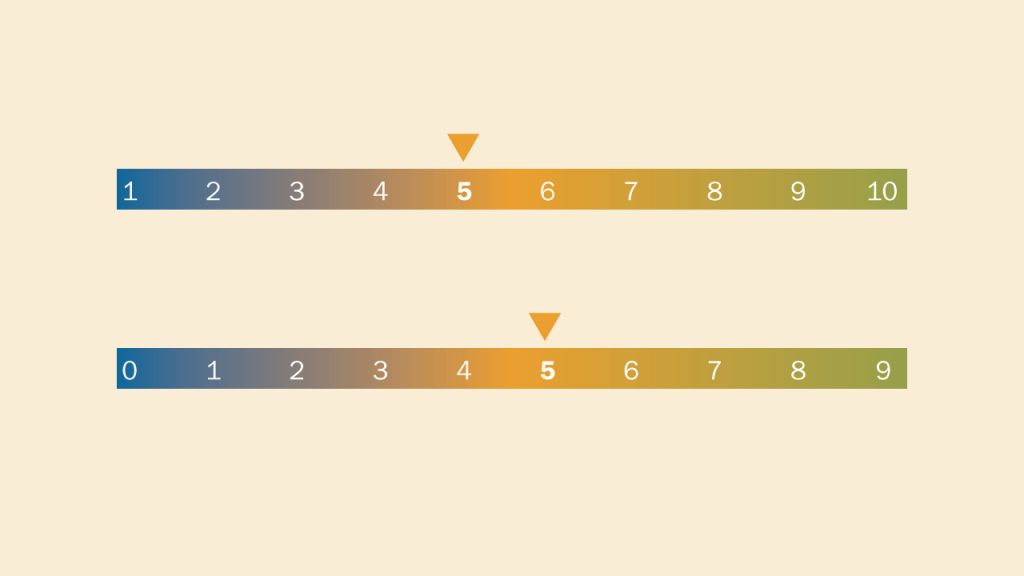
What is a scale?
The term scale of measurement is a combination of the terms measuring scale and scale of measurement. Items are assigned numerical values or semantic meanings to represent them when scaled. In essence, it refers to how variables are specified and divided into various categories in research and statistics.
The values given to the variables in a data collection are meant by the degree of measurement. Data variables are categorized or quantified using a measuring scale in statistics. The type of statistical technique to be used is determined by it. When doing statistical measurements, the type of data you get tells you what kind of measurement scale to use.
Why Do we need a scale?
Variables are used in quantitative research. A variable is a measurement that varies by at least two values across study participants or units of analysis. Since variables are the fundamental unit of exchange in research, any discussion of variables must also cover their qualities. Differentiating variables based on their measurement scale is among the most critical factors.
The scales can be used to quantify both qualitative and quantitative data. Interval and ratio scales measure quantitative data, whereas nominal and ordinal scales measure qualitative data. Each scale has a name, with the most popular nominal scale. The ordinal and interval scales are next, followed by the ratio scale.
It is crucial to understand measurement scales when studying statistical analysis methods. Running statistical studies and comprehending and interpreting the outcomes of those analyses will benefit greatly from understanding the measurement scales.
Scale type
The four fundamental units of measurement are nominal, ordinal, interval, and ratio. Let’s examine each scale of measurement in more detail.
- Nominal
As the name implies, a nominal variable is nothing more than a name for something. For example, we can say that individuals are different in variables like gender, race, color, caste, etc. For instance, gender might be a variable in a study. There could be two levels to this variable: male and female. In this instance, each variable group has been given a numerical code (1 for male, 2 for female).
In terms of analysis, statistical software can count how many times each level of a nominal variable happens by assigning it a number. Even though each variable level is assigned a number, it’s critical to remember that the numbers don’t convey the entire picture.
The variable is still categorical. Nominal variables must be understood as exhaustive and mutually exclusive in order to be understood. This implies that there can be only one group to which each analysis unit in the study can belong. As you can imagine, several things can be measured on a nominal scale.
However, apart from counting or expressing them in ratio or percentage, no other mathematical operation can be carried out on these variables.
- Ordinal Scale
Regarding the ordinal scale of measurement, the ordered characteristics criterion is added to the ordinal scale’s exhaustive and mutually exclusive criteria. This implies that a ranking can be given to the ordinal qualities. For instance, you might have completed a survey that used a Likert scale ranging from likely to unlikely.
As a result of each response, the variable is perceived as greater, but it is not possible to determine the exact difference in value between the likely and unlikely responses. Ordinal scales are highly arbitrary since respondents may have different definitions of what is reasonable or unlikely.
Consider another example of an ordinal variable, such as the rating, which might range from excellent, average, and poor.
We may claim that
- x percent of respondents assessed the product as excellent,
- y percent as average, and
- z percent as poor.
Ordinal variables are only affected by some mathematical variables, such as greater than or less than, and can only be computed using the median or range.
- Interval Scale
There are similar attributes on the interval level to those on the ordinal scale, but there is no difference in the spacing or values between the interval variables. To illustrate what equal spacing means, most elementary statistics texts use temperature and degrees Fahrenheit.
Temperature, as measured in Fahrenheit or Celsius, is an example of an interval scale. We may state that an 80-degree temperature is greater than a 40-degree temperature, but we cannot claim that 80 degrees are twice as hot as 40 degrees. We have created a reference scale for measuring time, but the Interval scale lacks a physical or true zero, which means that in the case of zero degrees temperature, it doesn’t mean there is no temperature.
Another example is the AD method for measuring time. Here, it is assumed that the starting reference point is zero.
- Ratio Scale
The ratio level is the last level of measurement, and the difference from the interval level is that it genuinely has zero value. As a result, ratio scales of measurement can be used.
One example of a ratio level variable is money expressed in US dollars. A person with a $20,000 yearly income is said to have twice as much money as someone with a $10,000 annual income. Zero income usually means no income on a ratio scale like the income variable.
Scale Type and Measurement
A ratio scale is the most detailed of the four levels of measurement and can be used to answer the most challenging research questions. In terms of order, the ratio level, which has a real zero value, is the highest level of measurement.
The interval level follows, which contains characteristics like equal and significant distances but no absolute zero. The next level is the ordinary level, which includes rank order. Finally, the lowest measurement level is the nominal level, which only has the attribute name.
Kultar Singh – Chief Executive Officer, Sambodhi


